
lesslater Analytics
How accurate the forecast is, and where the money is
Analytics show the forecast error, what stockout days have cost, how much capital is tied up in overstock, and which products matter most for revenue.
Try free for 14 days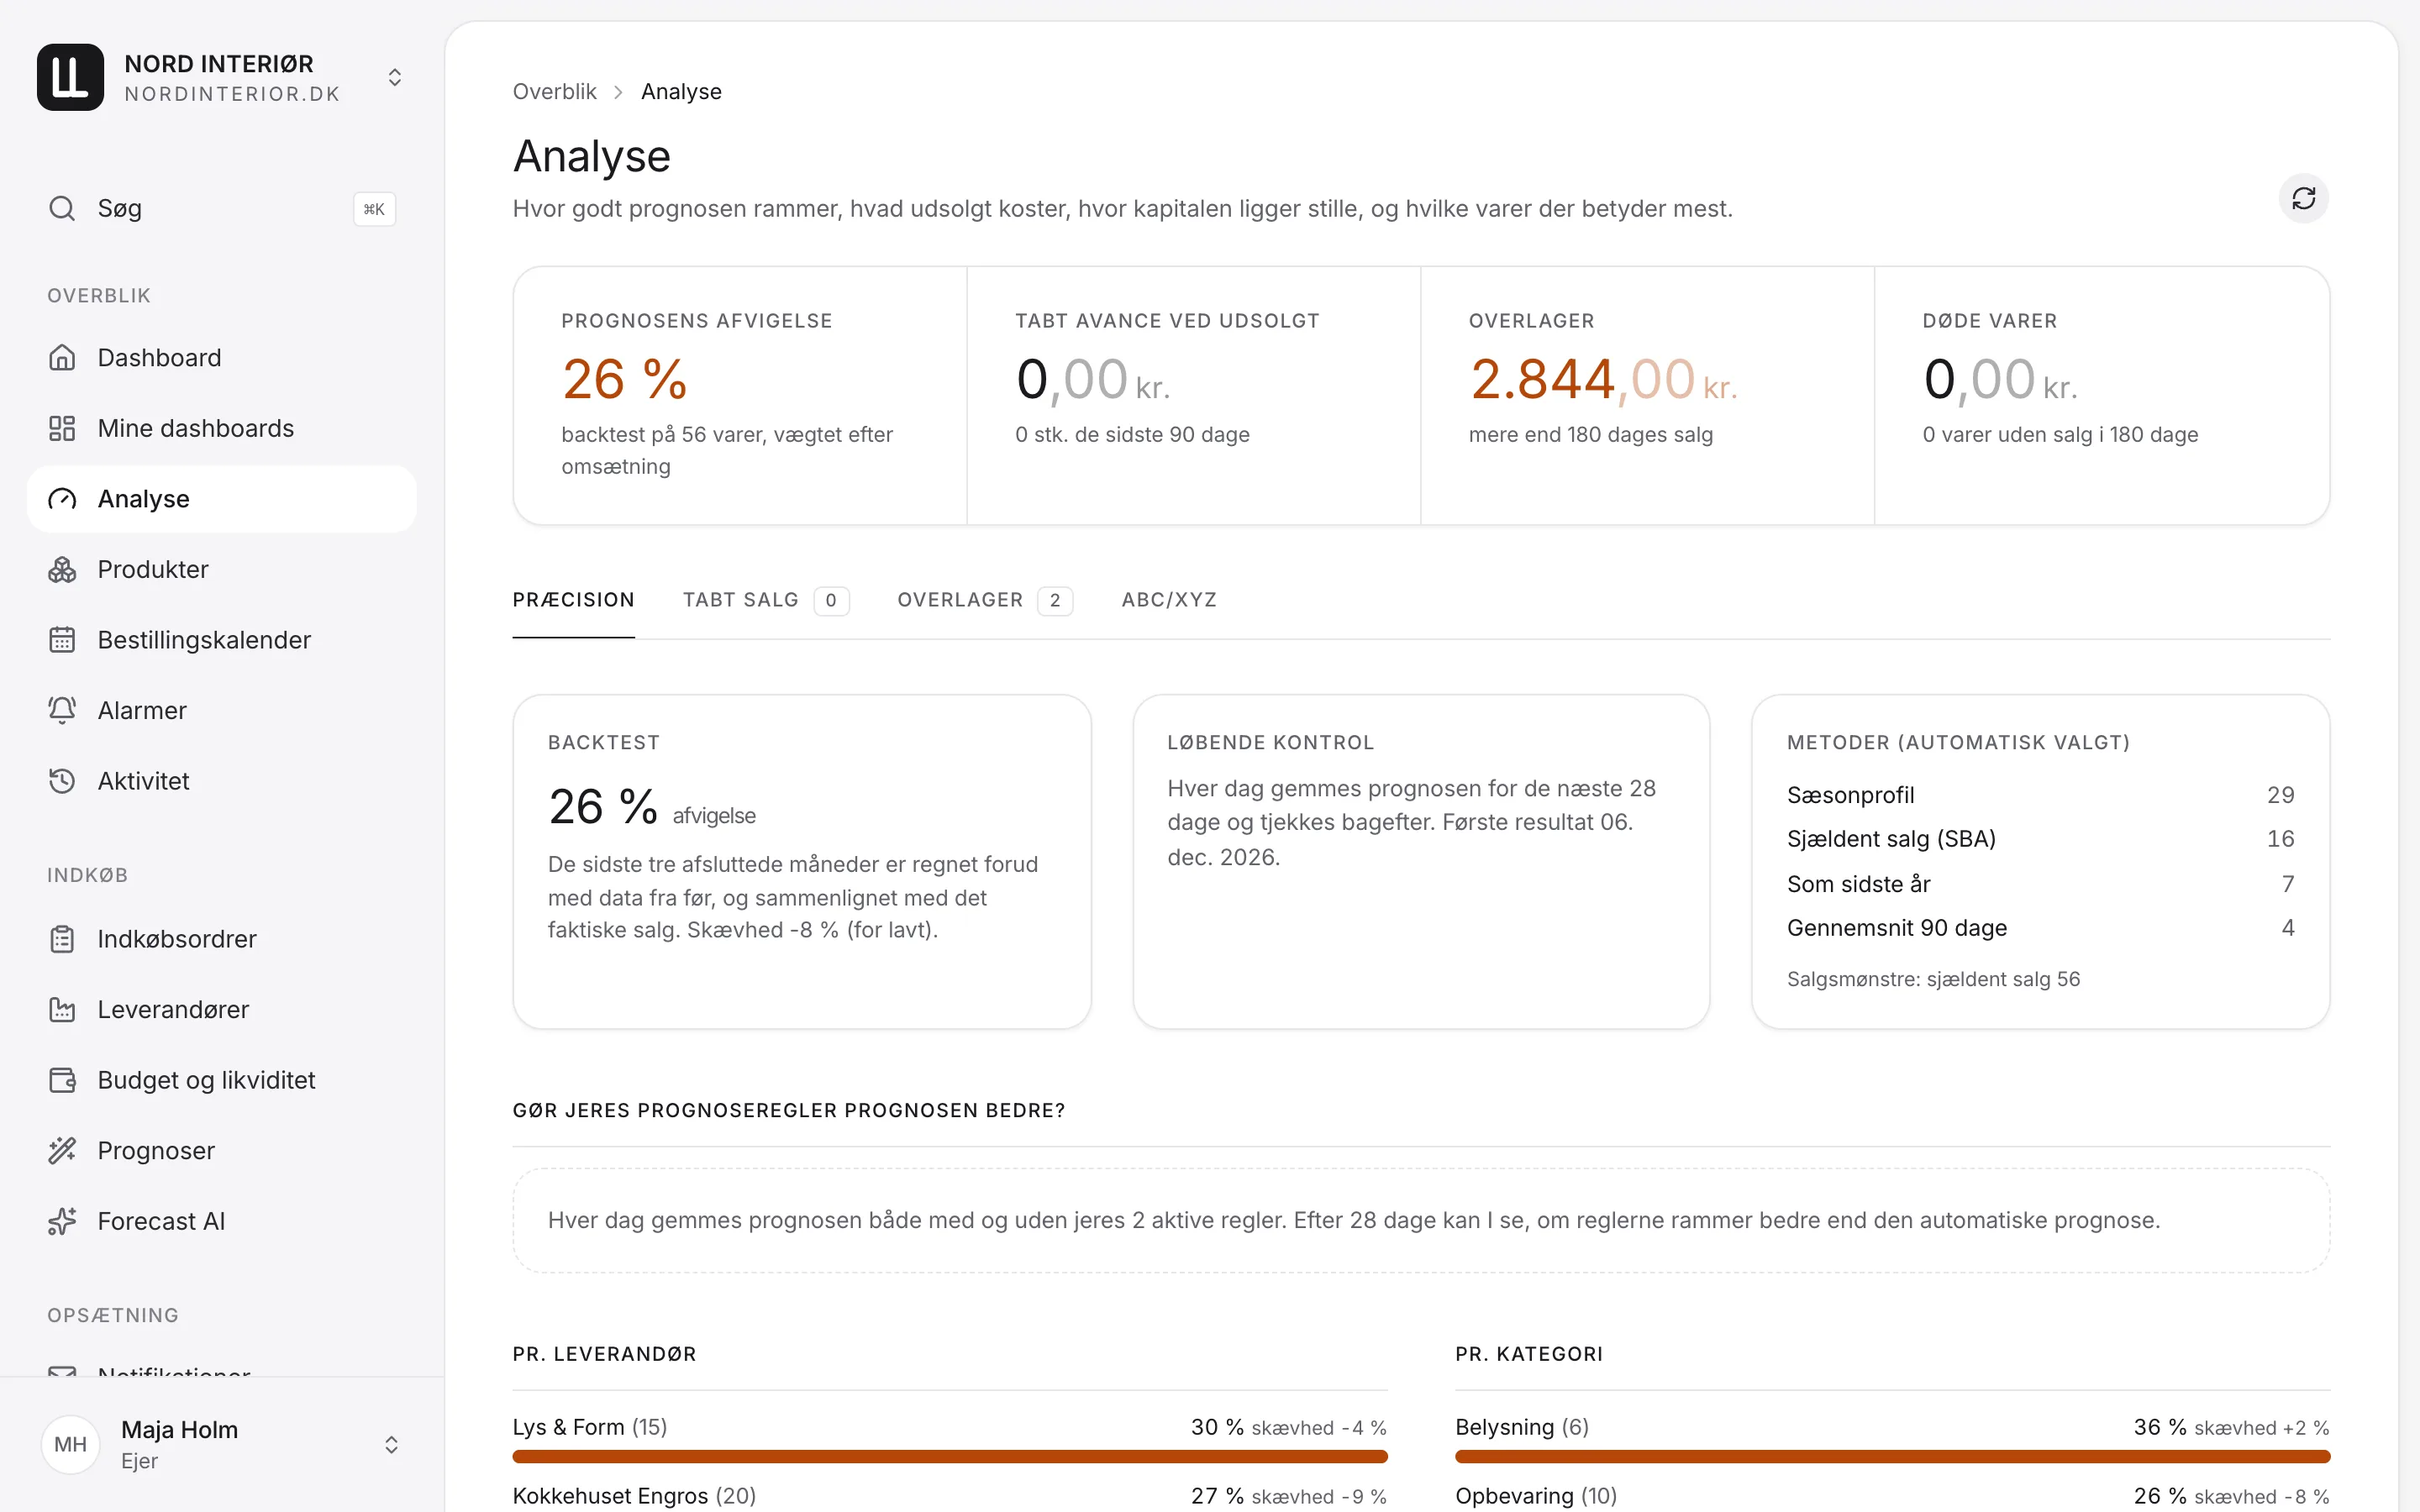
Accuracy
The backtest recalculates the last three months, and every day the forecast for the next 28 days is saved so it can be checked afterwards. Results are shown per supplier and category, including whether your own rules improve the forecast.
ABC/XYZ
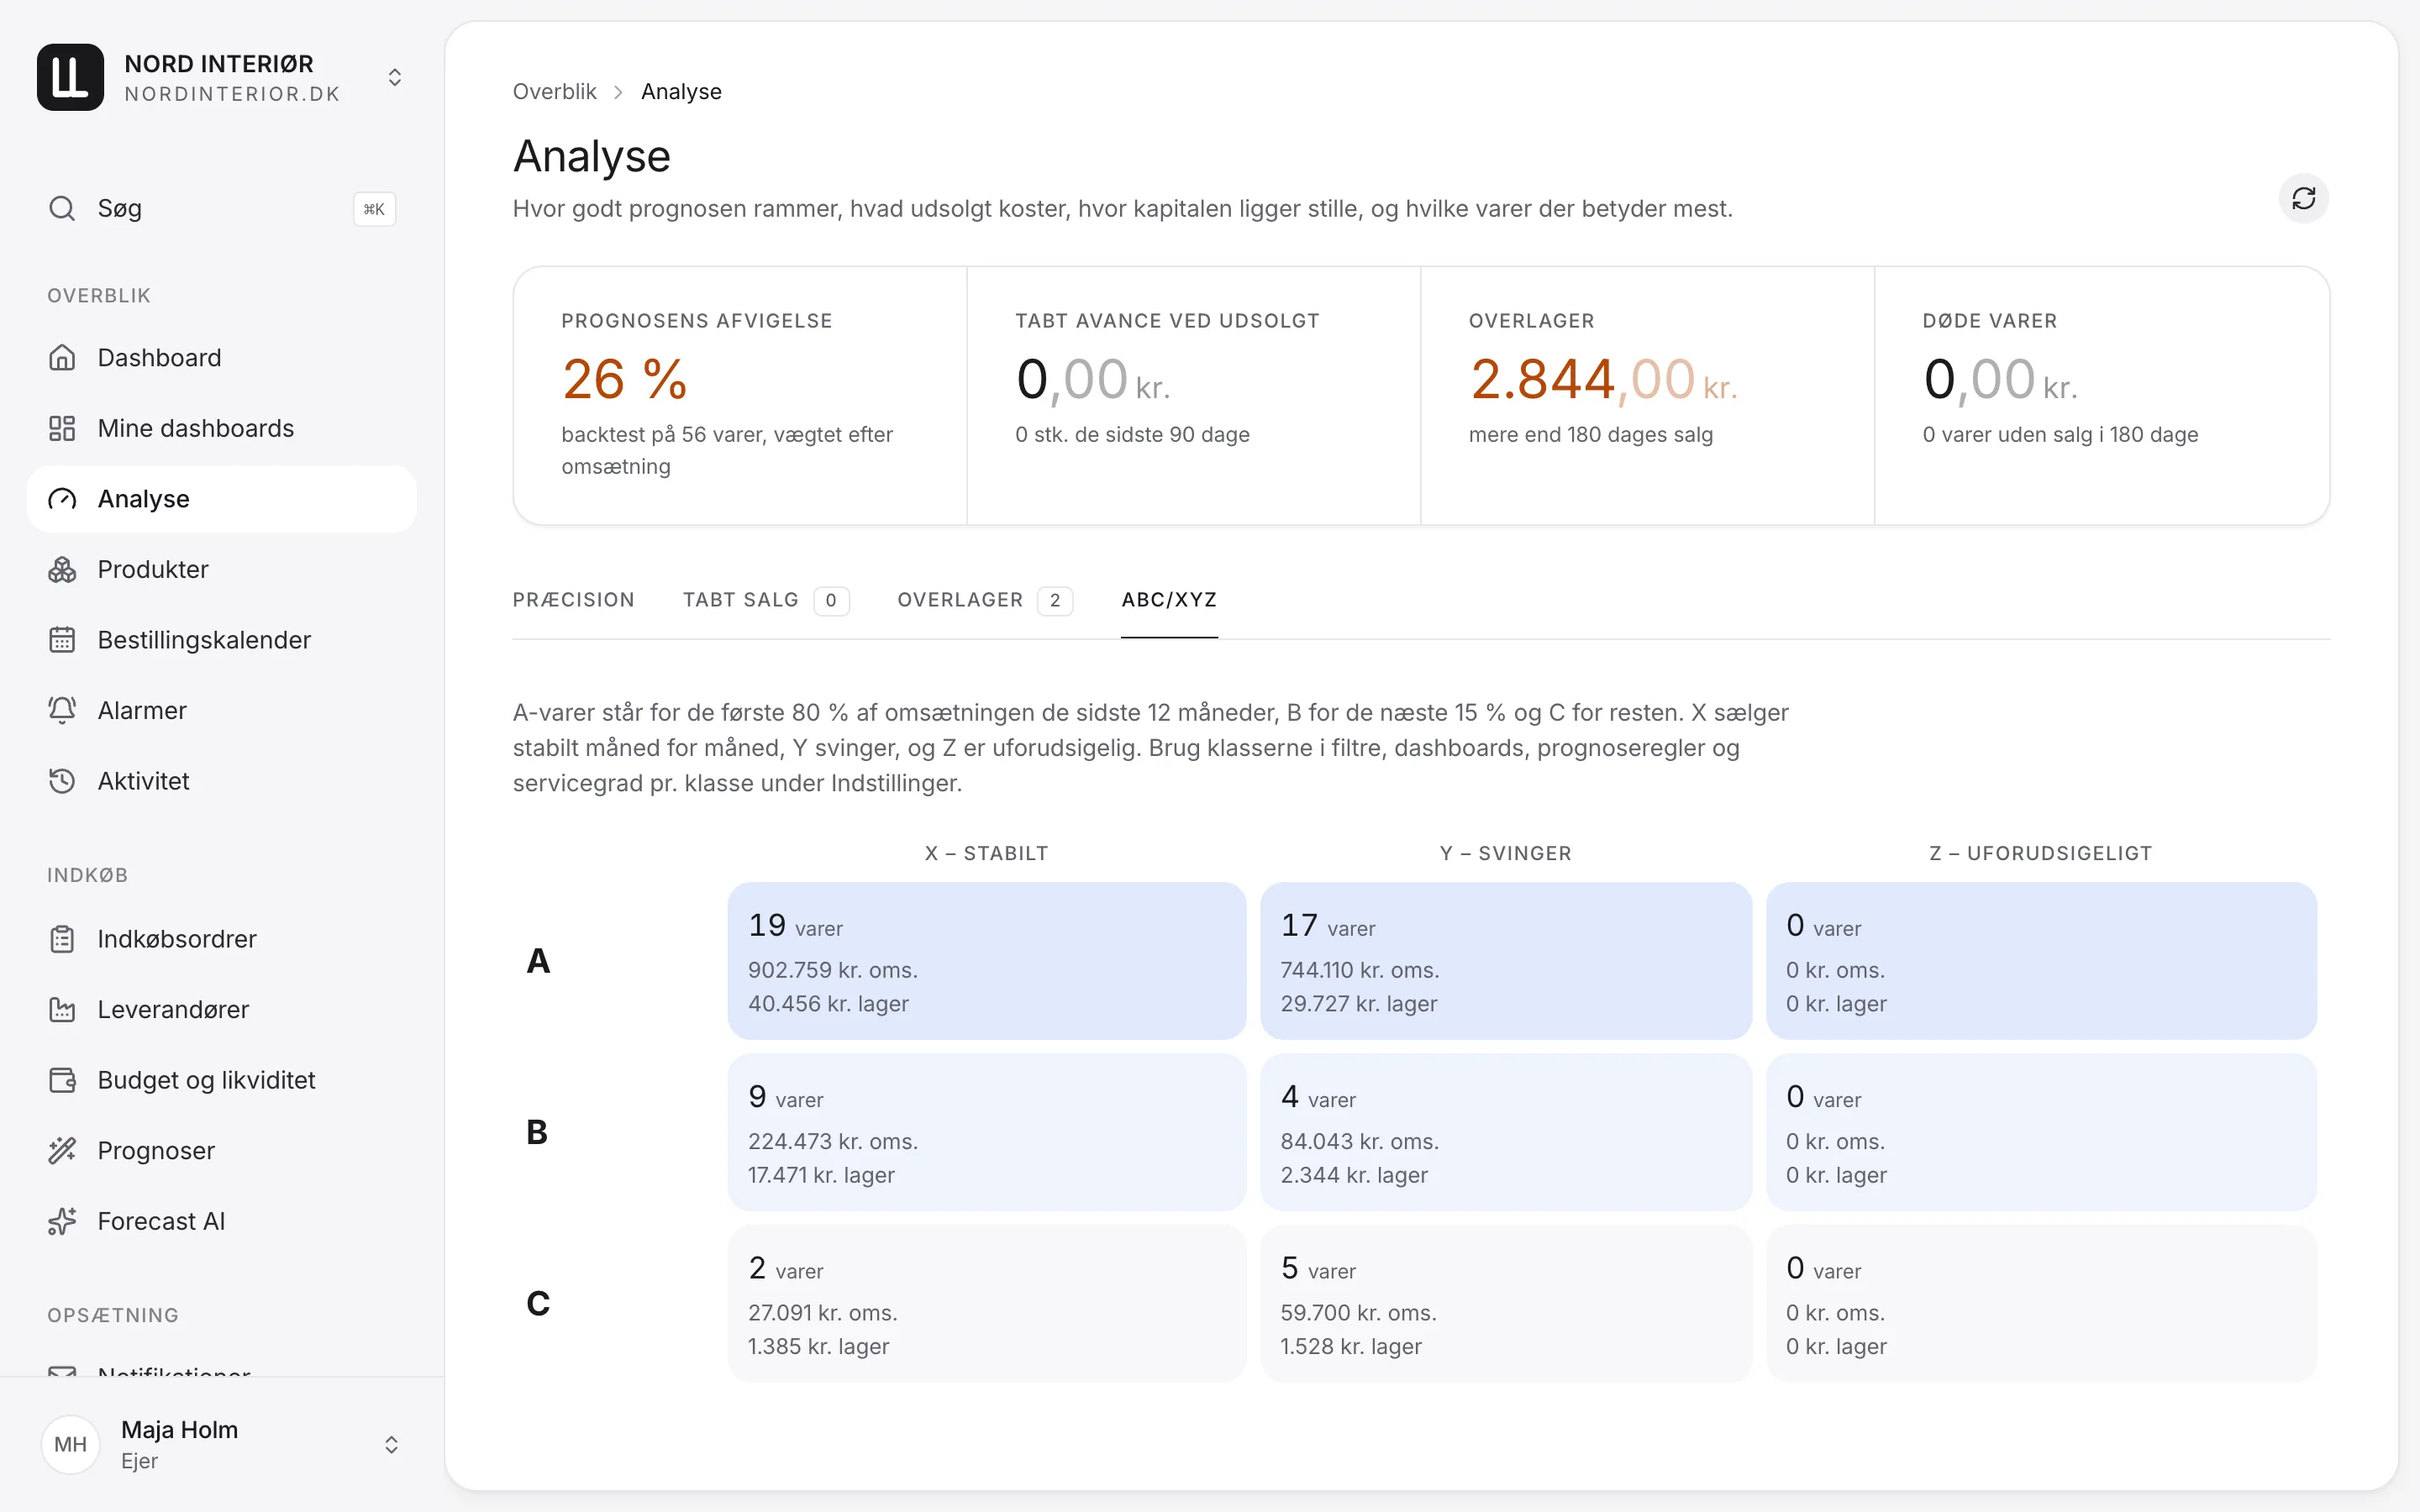
A products make up the first 80 % of revenue, B the next 15 % and C the rest. X sells steadily, Y fluctuates and Z is unpredictable. The classes are used in filters, forecast rules and service levels.
Dashboards
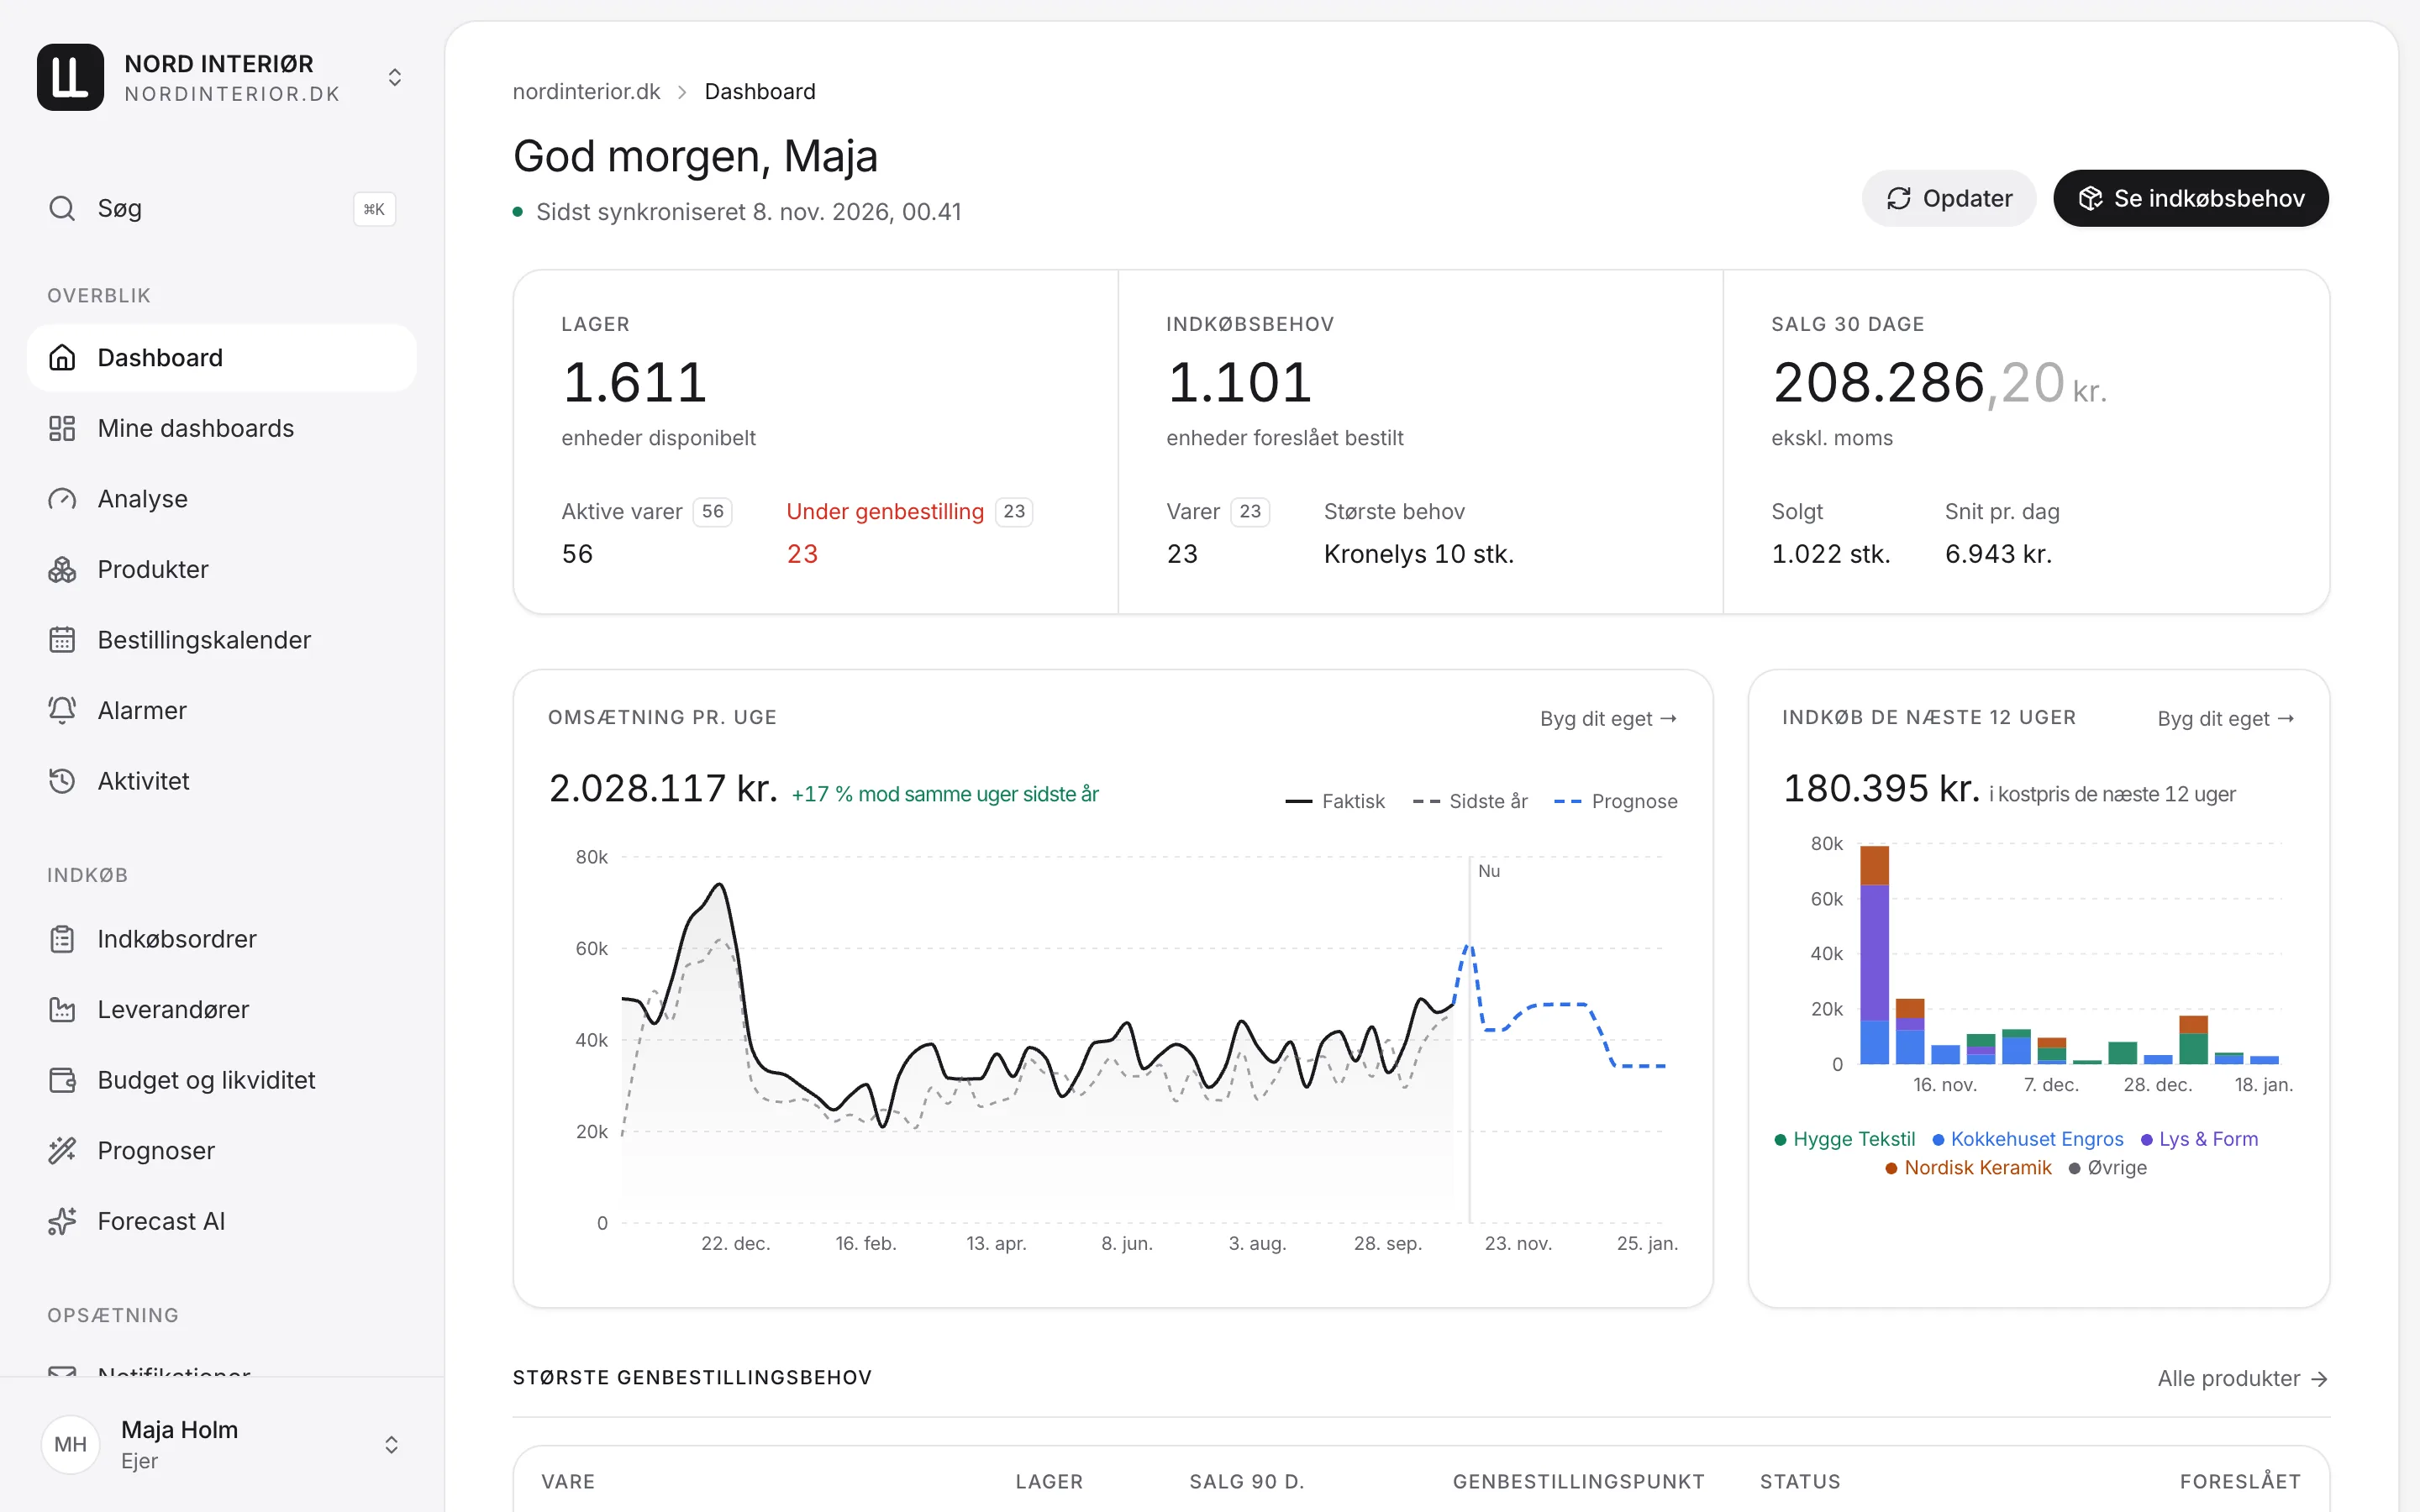
Build your own overviews with key figures, charts, forecasts and product lists, for example one per supplier or category.
See your own products in lesslater
Create an account and connect your webshop. The first 14 days are free, and no credit card is needed. If you would rather go through it on your own data with us, book a demo.
No credit card · No commitment · Data in the EU